Showing posts with label Java. Show all posts

Tuesday, July 27, 2010

DGC II: The JVM Tuning

This blog post is part of the DevOps Guide to Confluence series. In this chapter of the guide, I’ll be focusing on JVM tuning with the aim to make our Confluence perform well and operate reliably.

JDK Version

First things first: use a recent JDK. Java 5 (1.5) has been EOLed 1.5 years ago, there is absolutely no reason for you to use it with Confluence. As George pointed out in his presentation, there are some significant performance gains to be made just by switching to Java 6 and you can get another performance boost if you upgrade from an older JDK 6 release to a recent one. JDK 6u21 is currently the latest release and that’s what I would pick if I were to set up a production Confluence server today.

If you are wondering about which Java VM to use, I suggest that you stick with Sun’s HotSpot (also known as Sun JDK). It’s the only VM supported by Atlassian and I really don’t see any point in using anything else at the moment.

Lastly it goes without saying that you should use -server JVM option to enable the server VM. This usually happens automatically on server grade hardware, but it's safer to set it explicitly.

VM Observability

For me using JDK 6 is not just about performance, but also about observability of the VM. Java 6 contains many enhancements in the monitoring, debugging and probing arena that make JDK 5 and its VM look like an obsolete black box.

Just to mention some enhancements, the amount of interesting VM telemetry data exposed via JMX is amazing, just point a VisualVM to a local Java VM to see for yourself (no restart or configuration needed). Be sure to install VisualGC plugin for VisualVM. In order to allow remote connections you’ll need to start the JVM with these flags:
-Dcom.sun.management.jmxremote.port=some_port
-Dcom.sun.management.jmxremote.password.file=/path/to/jmx_pw_file
-Djavax.net.ssl.keyStore=/path/to/your/keystore
-Djavax.net.ssl.keyStorePassword=your_pw


Unless you make the port available only on some special admin-only network, you should password protect the JMX endpoint as well as use SSL. The JMX interface is very powerful and in the wrong hands could result in security issues or outages caused by inappropriate actions.

For more info about all the options available read this document.

In addition to JMX, on some platforms there is also good DTrace integration which helped me troubleshoot some Confluence issues in production without disrupting our users.
And lastly there is BTrace that allowed me to troubleshoot a nasty hibernate issue once. It's a very handy tool that as opposed to DTrace, works on all OSes.

I can’t stress enough how important continuous monitoring of your Confluence JVMs is. Only if you know how your JVMs and app are doing, you can tell if your tuning has any effect. George Barnett has also a set of automated performance tests which are handy to load test your test instance and compare results before and after you make some tweaks.

Heap and Garbage Collection Must Haves

After upgrading the JDK version, the next best thing you can do is to give Confluence lots of memory. In the infrastructure chapter of the guide, I mentioned that you should prepare your HW for this, so let’s put this memory to use.

Before we set the heap size, we should decide between 32-bit JVM and 64-bit JVM. 64-bit VM is theoretically a bit slower, but allows you to create huge heaps. 32-bit JVM has heap size limited by the available 32-bit address space and other factors. 32bit OSes will allow you to create heaps up to only 1.6-2.0 GB. 64bit Solaris will allow you to create 32bit JVMs with up to 4GB heap (more info). For anything bigger than that you have to go 64bit. It’s not a big deal, if your OS is 64bit already. The option to start the VM in 64bit mode is -d64. On almost all platforms the default is -d32.

Before I go into any detail, I should explain what are the main objectives of heap and garbage collection tuning for Confluence. The objectives are:
  • heap size - we need to tell JVM how much memory to use
  • garbage collector latency - garbage collection often requires that the JVM stops your application, this is GC pauses are often invisible, but with large heaps and under certain conditions might become very significant (30-60+ seconds)


Additionally we should also know a thing or two about how Confluence uses the heap. The main points are:
  • Objects created by Confluence and stored on the heap generally fall into three categories:
    • short-lived objects - life-cycle of these is bound to a http request
    • medium-lived objects - usually represent cache entries with shorter TTL
    • long-lived objects - represent cache entries with big TTL, settings and infrastructure objects (plugin framework, rendering engine, etc), cache entries taking most of the space.
  • Confluence creates lots of short-lived objects per request
  • Half or more of the heap will be used by long-lived cache objects


By combining our objectives with our knowledge of Confluences heap profile, our tuning should focus on providing enough heap space for the application to have space for the cache, short-lived objects, as well as some extra buffer. Given that long-lived objects will (eventually) reside in the old generation of the heap, we want to avoid promoting short-lived objects there, because otherwise we’ll then need to do massive garbage collections of the old generation unnecessarily. Instead we should try to limit the promotion from young generation only to those objects, that will likely belong to the long-lived category.

We’ll also need to figure out how much heap you need to use. Unfortunately there isn’t an easy way to find this out, except for some educated guessing and trial & error. You can also read this HW Requirements document from Atlassian that can give you an idea about some starting points. I believe we started at 1GB, but over time went through 2GB, 3GB, 3.5GB, 4GB, 5GB all the way to 6GB.

The Confluence heap size depends on the number of concurrent users and the amount of content you have. This is mainly because Confluence uses a massive (well, in our case it is) in-process cache that is stored on the heap. We’ll get to Confluence and cache tuning in a later chapter of this guide.

So let’s set the max heap size. This is done via -Xmx JVM option:
-Xmx6144m 
-Xms6144m
The additional -Xms parameter says that the JVM should reserve all 6GB at startup — this is to avoid heap resizing which can be slow, especially when dealing with large heaps.

The rest of the heap settings in this post are based on 6GB heap size, you might need to make appropriate changes to adjust for your total heap size.

The next JVM option is -Xmn, which specifies how much of the heap should be dedicated to young generation (you should read up on generational gc if you don’t know what I’m talking about). The default is something like 25% or 33%, I set the young generation to ~45% of the entire heap:
 -Xmn2818m

Increasing the permanent generation size is also usually required given the number of classes that Confluence loads. This is done via -XX:MaxPermSize option:
-XX:MaxPermSize=512m

Given that determining the right heap size for your environment is non-trivial task for larger instances, especially if occasional memory leaks start consuming the precious memory, you always want to have as much data as possible to debug memory exhaustion issues. Aside from good monitoring (which I mentioned in the previous chapter) you should also configure your JVM to dump the heap, when an OutOfMemoryException occurs. You can then analyze this heap dump for potential memory leaks.

Since we are dealing with relatively big heaps, make sure you have enough space on the disk (heap dumps for 6GB heap usually take 2-4GB). I’ve had a very good experience using Eclipse Memory Analyzer to analyze these large heaps (VisuaVM or jhat are not up for analyzing heaps of this size). The relevant JVM options are:
-XX:+HeapDumpOnOutOfMemoryError
-XX:HeapDumpPath=/some/relative/or/absolute/dir/path

While trying to minimize gc latency in order to avoid situations when users have to wait several seconds for the stop-the-world (STW) gc to finish before their pages render is a commendable thing to do, the main reason why you want to do this is to avoid Confluence cluster panics.

Confluence has this “wonderful” cluster safety mechanism that is sensitive to any latency bigger than a few tens of seconds. In case a major STW gc occurs, the cluster safety code might announce cluster panic and shut down all the nodes (that’s right, all the nodes, not just the one that is misbehaving).

In order to be informed of any latencies caused by gc, you need to turn on gc logging. This is the magic combination of switches that works well for me:
-Xloggc:/some/relative/or/absolute/path/wikis-gc.log 
-XX:+PrintGCDetails 
-XX:+PrintGCTimeStamps 
-XX:+PrintGCDateStamps 
-XX:+PrintTenuringDistribution

Unfortunately the file specified via -Xloggc will get overwritten during a jvm restart, so make sure you preserve it either manually before a restart or automatically via some restart script. Additionally reading the gc log is a tough job that requires some practice and since the format varies a lot depending on your JDK version and garbage collector, I’m not going to describe it here.

Performance tweaks

The first performance boosting JVM option I'd like to mention is -XX:+AggressiveOpts, which will turn on performance enhancements that are expected to be on by default in the future JVM versions (more info).

If you are using 64bit JVM then -XX:+UseCompressedOops will make a big difference and will virtually eliminate the performance penalty you pay for switching from 32bit to 64bit JVM.

And lastly there is -XX:+DoEscapeAnalysis which will boost the performance by another few percents.

Optional Heap and GC tweaks

To slow down object promotion into the old generation, you might want to tune the sizes of the survivor space (a heap generation within the young generation). To achieve this, we want the survivor space to be slightly bigger than the default. Additionally I also want to keep the promotion rate down (objects that survive a specific number of collections in the survivor space will be be promoted to the older generation), so I use these options:
-XX:SurvivorRatio=6
-XX:TargetSurvivorRatio=90

I also found that by using parallel gc for the young generation and concurrent mark and sweep gc for the older generation I can practically eliminate any significant SWT gc pauses. Your mileage might vary on this one, so do some testing before you use it in production. These are the settings I use:
-XX:+UseConcMarkSweepGC
-XX:+UseParNewGC
-XX:CMSInitiatingOccupancyFraction=68
-XX:MaxTenuringThreshold=31
-XX:+CMSParallelRemarkEnabled

Resources

The information above was gather from years of experience as well as various sources, including the following:

Running Multiple Web Apps in one VM

Don't do that. Really. Don't. Bad things will happen if you do (OOME, classloading issues etc).

Conclusion

Your JVM should now be in a good shape to host Confluence and serve your clients. In the next chapter of this guide I'll write about Confluence configuration, tuning, upgrades and more.

Saturday, November 14, 2009

Using Mercurial Bisect to Find Bugs

Yesterday I tried to find a regression bug in Grizzly that was preventing grizzly-sendfile from using blocking IO. I knew that the bug was not present in grizzly 1.9.15, but somewhere between that release and the current head someone introduced a changeset that broke things for me. Here is how I found out who that person was.

Grizzly is unfortunately still stuck with subversion, so the only thing (besides complaining) that I can do to make my life easier, is to convert the grizzly svn repo to some sane SCM, such as mercurial. I used hgsvn to convert the svn repo.

Once I had a mercurial repo, I wrote BlockingIoAsyncTest - a JUnit test for the bug. And that was all I needed to run bisect:
$ echo '#!/bin/bash                                                                          
mvn clean test -Dtest=com.sun.grizzly.http.BlockingIoAsyncTest' > test.sh
$ chmod +x test.sh
$ hg bisect --reset #clean repo from any previous bisect run
$ hg bisect --good 375 #specify the last good revision
$ hg bisect --bad tip #specify a known bad revision
Testing changeset 604:82e43b848ae7 (458 changesets remaining, ~8 tests)
517 files updated, 0 files merged, 158 files removed, 0 files unresolved
$ hg bisect --command ./test.sh #run the automated bisect
...
(output from the test)
...
...
...

[INFO] ------------------------------------------------------------------------
[INFO] BUILD SUCCESSFUL
[INFO] ------------------------------------------------------------------------
[INFO] Total time: 9 seconds
[INFO] Finished at: Sat Nov 14 11:41:07 PST 2009
[INFO] Final Memory: 25M/79M
[INFO] ------------------------------------------------------------------------
Changeset 500:983a3fc2debe: good
The first good revision is:
changeset:   501:b5239bf9427b
branch:      code
tag:         svn.3343
user:        jfarcand
date:        Wed Jun 17 17:20:32 2009 -0700
summary:     [svn r3343] Fix for https://grizzly.dev.java.net/issues/show_bug.cgi?id=672
In under two minutes I found out who and with which revision caused all the trouble! Bisect is very useful for large projects, developed by multiple users, where the amount of code and changes is not trivial. Finding regressions in this way can save a lot of time otherwise spent by debugging.

The only caveat I noticed is that you need to create a shell script that is passed in as an argument to the bisect command. It would be a lot easier if I could just specify the maven command directly without the intermediate shell script.

Thursday, May 28, 2009

grizzly-sendfile to Become an Official Grizzly Module

After a chat with JFA about grizzly-sendfile's future, I'm pleased to announce today that grizzly-sendfile 0.4 will be the first version of grizzly-sendfile released as an official module of grizzly. This is a huge news for grizzly-sendfile and I believe an equally important news for grizzly and its community.

What this "merger" means for grizzly-sendfile:

  • great opportunity to extend the reach
  • opportunity to become the default static file handler in Grizzly
  • aspiration to become the default static file handler in GlassFish v3
  • more testing and QA
  • easier and faster access to grizzly developers and contributors

What this "merger" means for grizzly:

  • contribution of 1 year of research, development and testing time in the area of static http downloads
  • several times better performance and scalability of http static file downloads
  • built-in X-Sendfile functionality
  • better JMX instrumentation for http downloads
  • and more

If you can't wait for 0.4, go and get recently released version 0.3.

This is a great day for both projects! :-)

Project site: http://grizzly-sendfile.kenai.com/

Thursday, May 14, 2009

grizzly-sendfile 0.3 is out!

After a few months of late night hacking, grizzly-sendfile 0.3 is finally ready for prime time!

New features include:

I also started using kenai's JIRA for issue tracking. So feel free to file bugs or RFE's there.

Benchmark & Enjoy!

Project Website The source code The binaries

Sunday, May 10, 2009

grizzly-sendfile and Comparison of Blocking and NonBlocking IO

From the very early beginnings of my work on grizzly-sendfile (intro) I was curious to compare blocking and non-blocking IO side to side. Since I didn't have any practical experience to understand which one would be more suitable when, I designed grizzly-sendfile to be flexible so that I could try different strategies and come to conclusions based on some real testing rather than theorizing or based on the words of others. In this post I'd like to compare blocking and nonblocking IO, benchmark them, and draw some conclusions as to which one is more suitable for specific situations.

grizzly-sendfile has a notion of algorithms that control the IO operations responsible for writing data to a SocketChannel (grizzly-sendfile is based on NIO and leverages lots of great work put into grizzly). Different algorithms can do this in different ways, and this is explained in depth on the project wiki. The point is that this allows me to create algorithms that use blocking or nonblocking IO in different ways, and easily swap them and compare their performance (in a very isolated manner).

Two algorithms I implemented right away were SimpleBlockingAlgorithm (SBA) and EqualNonBlockingAlgorithm (ENBA), and only recently followed by EqualBlockingAlgorithm (EBA). The first one employs the traditional approach of sending a file via the network (while not EOF write data to a SocketChannel using blocking writes), while ENBA uses non-blocking writes and Selector re-registration (in place of blocking) to achieve the same task. This means that a download is split into smaller parts, each sequentially streamed by an assigned worker thread to the client. EBA works very similarly to ENBA, but uses blocking writes.

I ran two variations of my faban benchmark[0] against these three algorithms. At first I made my simulated clients hit the server as often as possible and download files of different sizes as quickly as possible. Afterward I throttled the file download speed to 1MB/s per client (throttling was done by clients). While the first benchmark simulates traffic close to the one on the private network in a datacenter, the second benchmarks better represents client/server traffic on the Internet.

grizzly-sendfile delegates the execution of the selected algorithm to a pool of worker threads, so the maximum number of the treads in the pool, along with the selected algorithm, are one of the major factors that affects the performance[1] and scalability[2] of the server. In my tests I kept the pool size relatively small (50 threads), in order to easily simulate situations when there are more concurrent requests than the number of workers, which is common during traffic spikes.

Conc. ClientsDownload limitAlgorithmAvg init time[3] (sec)Avg speed[4] (MB/s)Avg total throughput (MB/s)
50noneSBA0.0194.36208.76
50noneENBA0.0214.15198.79
50noneEBA0.0184.23202.29
100noneSBA4.6664.32212.79
100noneENBA0.0481.84168.15
100noneEBA0.1401.96175.71
200noneSBA14.2884.31208.59
200noneENBA0.1080.87144.69
200noneEBA0.2640.97158.83


Conc. ClientsDownload limitAlgorithmAvg init time[3] (sec)Avg speed[4] (MB/s)Avg total throughput (MB/s)
501MB/sSBA0.0031.042.9
501MB/sENBA0.0020.9841.82
501MB/sEBA (81k)[5]0.0030.9841.91
501MB/sEBA (40k)[6]0.0020.9842.85
1001MB/sSBA20.51.040.4
1001MB/sENBA0.0030.9985.14
1001MB/sEBA (81k)0.0181.084.19
1001MB/sEBA (40k)0.0130.9984.34
2001MB/sSBA64.81.037.12
2001MB/sENBA0.1120.86141.8
2001MB/sEBA (81k)0.20.95156.59
2001MB/sEBA (40k)0.1590.96154.2
3001MB/sSBA113.91.034.2
3001MB/sENBA0.1850.58127.53
3001MB/sEBA (81k)0.310.61133.66
3001MB/sEBA (40k)0.2390.63132.75


The interpretation of the results is that with SBA the individual download speeds are slightly higher than when ENBA or EBA is used (this is mainly due to some extra scheduling related to the Selector reregistration). However, EBA and ENBA can utilize the available server bandwidth significantly better than SBA. This is especially true when there is a large number of slow clients downloading larger files. One big downside of SBA is that if the number of concurrent downloads is higher than the number of worker threads, the time to initiate download easily increases into extreme heights.

The conclusion is that SBA is well suited for controlled environments where there is a small number of fast clients (server-to-server communication on an internal network), while EBA shines in environments where there is very little control over the number and speed of clients (file hosting on the Internet). While EBA performs and scales better than ENBA, two advantages that ENBA has over EBA are smaller latency and higher resiliency to DoS or DDoS attacks when malicious clients open connections and block.

The results above do not represent well the performance and throughput of grizzly-sendfile (the benchmarks were run on my laptop!), but they certainly provide some evidence that can be used to determine characteristics of different algorithms. I'll do some more thorough testing later when I feel that grizzly-sendfile has enough features and it is time for some fine tuning (there is still a lot that can be done to make things more efficient).

I love explaining things visually, so I drew the following diagrams that describe the differences between the two algorithms much better than many words.

SimpleBlockingAlgorithm

The server can concurrently handle only the same number of requests as the number of worker threads in the pool. All the extra downloads have to be queued until one of some workers completes a download. The downloads take shorter to process, but the worker is blocked while a write is blocked. The slower the client the more blocking occurs and the worker utilization (and server throughput) goes down.

EqualNonBlockingAlgorithm

The number of downloads a server can concurrently handle is not limited by the number of workers. The downloads take slightly longer to process, but the workers are much better utilized. The increase in utilization is due to the fact that no blocking occurs and workers can multiplex - "pause" downloads for which clients are processing the data (stored in OS/network buffers). In the meantime workers can serve whichever client is ready to receive more data. This causes the download to be split into several parts, each possibly served by a different worker thread.

EqualBlockingAlgorithm

This algorithm is a combination of the previous two. It uses blocking IO and multiplexing. I think that thanks to multiplexing the client has more time to process data in OS/network buffers and thus deplete the buffer more than without multiplexing, which results in less blocking. The blocked writes are also more efficient because they decrease the number of parts a download is split into and thus decrease the amount of overhead associated with re-registration.

Based on these benchmarks, I'm going to call EqualBlockingAlgorithm the winner and make it the default grizzly-sendfile algorithm for now. It is quite easy to override this via the grizzly-sendfile configuration, so one will still be able to pick the algorithm that fits their deployment environment the best. To be honest the results of EBA benchmarks surprised me a bit because I expected ENBA to be the winner in throttled tests, so I'm really glad that I went into the trouble of creating and benchmarking it.

All this work will be part of the 0.3 release, which is due any day now. Follow the project on kenai and subscribe to the announce mailing list if you are interested to hear more news.


[0] a few notes on how I tested - both clients and the grizzly-sendfile-server were running on my mac laptop using Java 6 and server vm. I set the ramp up period to 1min so that the server can warm up and then I started counting downloads for 10min and calculated the result. Files used for the tests were 1KB, 200KB, 500KB, 1MB 20MB and 100MB large and equaly represented. All the tests passed with 0 errors. A download is successful when the length, md5 checksum and http headers match expected values.
[1] performance - ability to process a single download quickly
[2] scalability - ability to process large number of concurrent downloads at acceptable performance
[3] init time - duration from the time a request is made, until the first bytes of the http response body (not headers) are received
[4] avg speed - for 100MB files. The smaller the file the lower the effective download speed because of the overhead associated with a download execution.
[5] EBA (81k) - EqualBlockingAlgorithm with buffer size 81KB (the default socket buffer size on mac)
[6] EBA (40k) - EqualBlockingAlgorithm with buffer size 40KB

Tuesday, March 31, 2009

Identifying ThreadLocal Memory Leaks in JavaEE Web Apps

A few weeks ago wikis.sun.com powered by Confluence "Enterprise" Wiki grew beyond yet another invisible line that triggered intermittent instabilities. Oh boy, how I love these moments. This time the issue was that Confluence just kept on running out of memory. Increasing the heap didn't help, even breaking the 32bit barrier and using a 64bit JVM was not good enough to keep the app running for more than 24 hours.

The Xmx size of the heap suggested that something was out of order. It was time to take a heap dump using jmap and check what was consuming so much memory. I tried jhat to analyze the heap dump, but 3.5GB dump was just too much for it. The next tool I used was IBM's Heap Analyzer - a decent tool, which was able to read the dump, but consumed a lot of memory in order to do so (~8GB), and was pretty hard to use once the dump was processed.

While looking for more heap analyzing tools, I found SAP Memory Analyzer, now known as Eclipse Memory Analyzer, a.k.a MAT. I thought "What the heck does SAP know about JVM?" and reluctantly gave it a try, only to find out how prejudiced I was. MAT is a really wonderful tool, which was able to process the heap really quickly, visualize the heap in a easy-to-navigate way, use special algorithms to find suspicious memory regions, and all of that while using only ~2GB of memory. An excellent preso that walks through MAT features and how heap and memory leaks work, can be found here.

Thanks to MAT I was able to create two bug reports for folks at Atlassian (CONF-14988, CONF-14989). The only feature I missed was some kind of PDF or HTML export, but I did quite well with using Skitch to take screenshots and annotate them.

One of the leaks was confirmed right away, while it wasn't clear what was causing the other one. All we knew was that significant amounts of memory were retained via ThreadLocal variables. More debugging was in order.

I got this idea to create a servlet filter, that would inspect the thread-local store for the thread currently processing the request and log any thread-local references that exist before the request is dispatched down the chain and also when it comes back. Such a servlet could be packaged as a Confluence Servlet Filter Plugin, so that it is convenient to develop and deploy it.

There was only one problem with this idea, the thread-local store is a private field of the Thread class and is in fact implemented as an inner class with a package default access - kinda hard to get your hands on to. Thankfully private stuff is not necessarily private in Java, if you get your hands dirty with reflection code:
Thread thread = Thread.currentThread();

Field threadLocalsField = Thread.class.getDeclaredField("threadLocals");
threadLocalsField.setAccessible(true);

Class threadLocalMapKlazz = Class.forName("java.lang.ThreadLocal$ThreadLocalMap");
Field tableField = threadLocalMapKlazz.getDeclaredField("table");
tableField.setAccessible(true);

Object table = tableField.get(threadLocalsField.get(thread));

int threadLocalCount = Array.getLength(table);
StringBuilder sb = new StringBuilder();
StringBuilder classSb = new StringBuilder();


int leakCount = 0;

for (int i=0; i < threadLocalCount; i++) {
    Object entry = Array.get(table, i);
    if (entry != null) {
        Field valueField = entry.getClass().getDeclaredField("value");
        valueField.setAccessible(true);
        Object value = valueField.get(entry);
        if (value != null) {
            classSb.append(value.getClass().getName()).append(", ");
        } else {
            classSb.append("null, ");
        }
        leakCount++;
    }
}

sb.append("possible ThreadLocal leaks: ")
        .append(leakCount)
        .append(" of ")
        .append(threadLocalCount)
        .append(" = [")
        .append(classSb.substring(0, classSb.length() - 2))
        .append("] ");

logger.warn(sb);

A simple plugin like this, was able to confirm that the leaked SAXParser instances are created and stored as thread-local variables somewhere within the code that exports content as PDF. That is good enough info to pinpoint the exact line of code that creates the thread-local instance by BTrace (or code review), but that's a story for a separate blog post.

The morale of the story: ThreadLocal variables are a very powerful feature, which as is common for powerful stuff can result in a lot of nasty things when not used properly. Hopefully all the info I provided to Atlassian will be enough to get a speedy fix for the issue and bring stability to wikis.sun.com - at least until we step over the next "invisible line".

Thursday, February 05, 2009

Announcing grizzly-sendfile!

It's my pleasure to finally announce grizzly-sendfile v0.2 - the first stable version of a project that I started after I got one of those "Sudden Burst of Ideas" last summer.

For people who follow the grizzly development or mediacast.sun.com, this is not exactly hot news. grizzly-sendfile has been used by mediacast since last September and mentioned on the grizzly mailing list several times since then, but I haven't had time to promote it and explain what it does and how it works, so here I go.

If you don't care about my diary notes, skip down to "What is grizzly-sendfile".

A bit of background: the whole story goes back to the end of 2007 when a bunch of us where finishing up the rewrite of mediacast.sun.com in JRuby on Rails. At that time we realized that one of the most painful parts of the rewrite would be implementing the file streaming functionality. Back then Rails was single-threaded (not any more, yay!), so sending the data from rails was not an option. Fortunately, my then-colleague Peter, came up with an idea to use a servlet filter to intercept empty download responses from rails and stream the files from this filter. That did the trick for us, but it was a pretty ugly solution that was unreliable from time to time and was PITA to extend and maintain.

At around this time, I learned about X-Sendfile - a not well known http header - that some webservers (e.g. apache and ligttpd) support. This header could be used to offload file transfers from an application to the web server. Rails supports it natively via the :x_sendfile option of send_file method.

I started looking for the X-Sendfile support in GlassFish, which we have been using at mediacast, but it was missing. After some emails with glassfish and grizzly folks, mainly Jean-Francois, I learned that the core component of glassfish called grizzly could be extended via custom filters, which could implement this functionality.

The idea stuck in my head for a few weeks. I looked up some info on grizzly and NIO and then during one overnight drive to San Diego, I designed grizzly-sendfile in my head. It took many nights and a few weekends to get it into reasonable shape and test it under load with some custom faban benchmarks that I had to write, but in late August I had version 0.1 and was able to "sell" it to Rama as a replacement of the servlet filter madness that we were using at mediacast.

Except for a few initial bugs that showed up under some unusual circumstances, the 0.1 version was very stable. A few minor 0.1.x releases were followed by 0.2 version, which was installed on mediacast servers some time in November. Since then I've worked on docs and setting up the project at kenai.com.

What is grizzly-sendfile?

From the wiki: grizzly-sendfile is an extension for grizzly - a NIO framework that among other things powers GlassFish application server.

The goal of this extension is to facilitate an efficient file transfer functionality, which would allow applications to delegate file transfers to the application server, while retaining control over which file to send, access control or any other application specific logic.

How does it work?

By mixing some NIO "magic" and leveraging code of the hard working grizzly team, I was able to come up with an ARP (asynchronous request processing) filter for grizzly. This filter can be easily plugged in to grizzly (and glassfish v2) and will intercept all the responses that contain X-Sendfile header. The value of this header is the path of the file that the application that processed the request wants to send to the client.

All that an application needs to do is to set the header. In Java a simple example of such a code looks like this:
 response.setHeader("X-Sendfile", "/path/to/file.avi");
In Rails, it looks even nicer:
send_file '/path/to.png', :x_sendfile => true
That's it, grizzly-sendfile will take care of the rest.


Why should you care?


For me it was all about keeping my code clean and solving problems at layers where they made the most sense. Then it was also about performance and scalability - the kind of stuff that one can do with NIO, can't be now done in JavaEE because of its synchronous nature. And then of course it was about having full control over downloads (like successful download notification and other customizations that are possible via grizzly-sendfile plugins). Oh, and I must mention JMX monitoring:


What's next?

There is a lot of stuff on my roadmap. Two of the main missing features are partial downloads and glassfish v3 (grizzly 1.9.x) support. Then there is better monitoring and tons of performance and scalability tuning, which I haven't really focus on yet. A lot of the API still needs to be polished and cleaned-up. Also needed is a solid test suite that is more fine grained than the system/integration tests that I created with faban.

Can you use grizzly-sendfile?

Yeah, go for it. This is my pet project that I developed in my free time. The project is licensed under GPL2, so you can even grab the code if you want.

Can you help?

Sure. Code reviews, patches, suggestions and help with testing and documentation are more than welcome!

Wednesday, June 25, 2008

BTrace == DTrace for Java

Last week, I was trying to nail down a bug in SunWikis that was triggered by some kind of race condition. These kinds of issues are pretty nasty, especially if the application in question is a pretty complex beast, something that Confluence definitely qualifies as.

The debugger was no help because the timing had to be very precise for the issue to occur, and logging was totally useless because of zillions lines of logs that would be difficult to safely filter out. In many cases the information I needed was not present in logs anyway and since my guess was that the bug was coming from 3rd party code, logged data couldn't be easily expanded. DTrace, which I blogged about in my previous post, could have revealed some information, but I think that it would be very difficult to write a good D script that could give me some clues.

While waiting for my dev server to restart, I came across an interesting blog post that caught my eye. It mentioned this thing called BTrace, that I hadn't heard about before. It promised it to be a DTrace aimed at Java apps. With a fair amount of skepticism, I navigated to the BTrace website and started reading. Four things about BTrace earned my interest:
  • It's based on same or very similar principals as DTrace, but specialized for Java apps
  • No restarts necessary, you can observe a running app by connecting to a JVM identified by a PID
  • The BTrace programs are written in a language that is a subset of Java, and heavily based on annotations. This was a bit of a turnoff for me at first, until I found out that the programs don't need to be compiled manually but btrace takes care of that for me. Bravo!
  • I can call DTrace from my BTrace programs if I need to instrument native code or the OS


Armed with all this info and my eyes sparking, I wrote my first BTrace program and it worked as advertised! No restarts, no compilation, no hassle.

A few hours later, I had a program that was observing exactly those parts of Confluence that I needed. All of this while the application was running uninterrupted. I was able to snoop on how my code was interacting with Confluence and Confluence was in turn interacting with Hibernate in a way that I would have never dreamed of. All of this while concurrent events aimed at triggering the bug were happening.

Running BTrace programs is as easy as this:

$ ./bin/btrace \
-classpath hibernate-2.1.8-atlassian.jar:spring-hibernate2-2.0.6.jar \
6266 HibernateSessions.java

Where 6266 is the PID of my app/web server and HibernateSessions.java is my BTrace program.

Parts of the program looks like this (check out the javadoc comments for explanation of the code):

import com.sun.btrace.annotations.*;
import static com.sun.btrace.BTraceUtils.*;
import net.sf.hibernate.HibernateException;
import net.sf.hibernate.collection.PersistentCollection;
import net.sf.hibernate.engine.SessionImplementor;
import org.springframework.orm.hibernate.support.OpenSessionInViewFilter;

@BTrace
public class HibernateSessions {
/**
* A thread local variable used to filter out all the events that we
* are not interested it.
*/
@TLS private static boolean viaSso = false;
private static boolean printStack = false;

/** print a message when a thread enters doFilter method of SsoFilter */
@OnMethod(
clazz="com.sun.dse.wikis.auth.SsoFilter",
method="doFilter"
)
public static void enableProbing() {
println(str(currentThread(), " - Entered SSO Filter"));
viaSso = true;
}

/** print a message when exiting the doFilter method of SsoFilter */
@OnMethod(
clazz="com.sun.dse.wikis.auth.SsoFilter",
method="doFilter",
location=@Location(Kind.RETURN)
)
public static void disableProbing() {
println(str(currentThread(), " - Exited SSO Filter"));
viaSso = false;
}

/**
* print an message with a HibernateException is thrown, with detailed
* info about the current context
*/
@OnMethod(
clazz="net.sf.hibernate.HibernateException",
method=""
)
public static void onthrowreturn(HibernateException self, String s) {
println(str(currentThread(),
strcat(" - HibernateException was thrown: ",
strcat(s, strcat(" | collection: ", str(collection))))));
}

/**
* Print a message when Hibernate is attaching a collection to a session.
* This was crucial info for me to get in order to resolve the issue
*/
@OnMethod(
clazz="net.sf.hibernate.collection.PersistentCollection",
method="setCurrentSession",
location = @Location(Kind.RETURN)
)
public static void setSessionForCollection(boolean returnValue) {
if (returnValue == true) {
println(str(currentThread(),
strcat(" - a collection was attached to a session. Collection:",
str(collection))));
}
}


The result of this was a workaround for my code as well as a pretty detailed bug report that Atlassian confirmed to be a very similar to a confirmed bug that was reported recently. I could hardly achieve this without BTrace or without an in-depth knowledge of how all the Confluence code works.

As great as BTrace is, it is still a beta. If you decide to use it in production environment you should keep that in mind. During the several hours I spent working with BTrace, I experienced one JVM crash/lockup caused by BTrace. I bet that this kind of issues will be ironed out soon, and often this kind of risk is worth undertaking in order to resolve otherwise untraceable bugs.

Since last week, BTrace is part of my toolkit and I already have other mysteries on my ToDo list that I want to shine some light on with BTrace. I applaud the BTrace team for giving us this amazing tool!

Tuesday, June 24, 2008

DTrace and Java - Observations and Docs

For a long time I've been hearing about DTrace and how cool it was. I read a lot about it and saw some presentation on observing Java apps with DTrace, but only recently have I found enough free time to extensively play with it. And oh boy, it really is cool. But even with all this coolness, dtracing Java apps feels a bit awkward.

I think there are two reasons for that. The D language, which looks like C, but has a few fundamental differences, is pretty far from what Java developers are used to. And the second reason is the fact that DTrace is in reality instrumenting JVM and not the application running in the JVM. This means that dtracing Java is limited by abilities of the Java DTrace provider and also that the transition between the different layers of the stack can add some awkwardness.

Having said that, DTrace is really awesome and can be enormously helpful in many cases when developing or troubleshooting (Java) apps.

One thing I really miss in DTrace is regex support in any part of D scripts. There is a limited globbing support and some workarounds, but they ain't pretty.

Here are some DTrace resources that I found useful:

Monday, May 26, 2008

Catching StackOverflowError and a Bug in Regex Implementation in Java

Shortly after we launched SunWikis almost a year ago, we started having an issue with StackOverflowError, which was occurring when the content of certain wiki pages was being parsed and URLs where being extracted. I documented the issue in CONF-9392.

The problem is not really a bug in Confluence (even though using an overly-complex regular expressions doesn't help the case), but it's a problem in JDK. After a brief search at bugs.sun.com I found the root cause of our StackOverflowError documented as bug 6337993.

Originally I tried to mitigate the situation by increasing the memory reserved for the stack data via the -Xss JVM parameter. This helped a little bit, but wasn't good enough in most cases.

Last week I decided to go against everything I've been taught, and wrote a patch for Confluence that wraps the part of code that results in the StackOverflowError into a try/catch block. I know that any throwables that extend from Error should not be caught by a client code because they usually indicate a failure that only JVM should try to recover from, but IMO in the case of StackOverflowError, the situation is a bit different. That is mainly because before throwing the StackOverflowError, JVM pops the stack, so by the time the code execution gets to the catch block, JVM has already recovered from the error.

I don't claim this to be a solution to the problem, it's just a workaround that works better than increasing the stack size in this particular case. The fact that Confluence doesn't find all the URLs in wiki pages (used mainly to list outgoing links in the page info view) is just a small sacrifice, compared to inability to save or copy the page.

As for the solution, it seems that reimplementing Java's regular expressions library would be the most suitable one. I tried to run a code that fails in Java in JRuby, which uses a port of Oniguruma regex engine for Java and things worked flawlessly and as I read it also gives JRuby a performance boost over java.util.regex.

Wednesday, October 17, 2007

How to Install Mercurial Support in NetBeans

Getting NetBeans to grok Mercurial is pretty simple when you know all the gotchas. I already got stuck on the installation twice so I decided to turn this into a blog entry, so that I know what to do when I see the problem again. :)

To install Mercurial support in NetBeans, do the following:
  1. Get Mercurial and install it. On Mac you can install it via MacPorts
  2. Get NetBeans 6 and install it
  3. Install the Mercurial plugin via Tools->Plugins->Available Plugins->Mercurial
  4. Restart the IDE
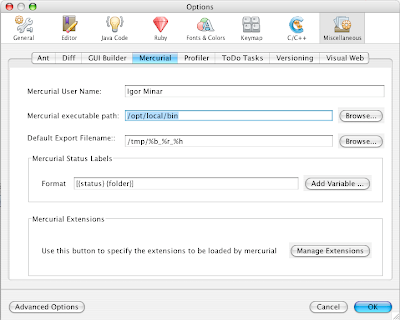
  5. If Versioning->Mercurials in the menu bar is disabled, go to Tools->Options->Miscelanious->Mercurial (on Mac NetBeans->Preferences->Miscelanious->Mercurial) and verify that Mercurial executable path is set up correctly - in my case, since I installed Mercurial via MacPorts, the path should be /opt/local/bin
  6. Restart the IDE

The problem, I encountered already twice, is that if the Mercurial executable path is not set up properly, the Versioning->Mercurials menu item is disabled and NetBeans doesn't give you any hint as to what went wrong. For some reason the path on my Mac is by default pointing to my python directory, which is not correct. Once the path is corrected and the IDE is restarted, everything works as expected.

Sunday, September 16, 2007

Solution for the Java Web Start Not Launching Problem

A couple months ago I noticed that I couldn't launch any Java Web Start application from my browser (by downloading and launching a *.jnlp file). When I try to launch an app, the Java Web Start logo appeared and after 20-30 seconds it went away and that was it. How frustrating!

Java Web Start


I struggled for a long time, but then I found a solution posted on a site.

All you need to do is to delete the cache:
rm ~/Library/Caches/Java/deployment.properties
Today the problem re-appeared, but armed with this knowledge, I fixed it in a second.

I have a feeling that this problem is somehow related to the preview version of JDK6 that I installed on my Mac. Apple, where is that darn JDK6 final?!?!? Unfortunately, even when Apple JDK6 is out, it most likely won't be any good for my Mac OSX 10.4 Tiger.

Wednesday, September 12, 2007

API Design and JSR 310 Replacing Java Date and Calendar Classes

It seems that today I'm stumbling upon a lot of interesting stuff.

While coding stuff for tomorrow's wikis.sun.com release, I watched this pretty good talk in which Joshua Bloch, once again, excellently addresses the issues and pitfalls of API design:


During the talk, Joshua makes an interesting comment. A JSR was created earlier this year, that is supposed to *finally* replace the crippled Date and Calendar classes in JDK. JSR 310: Date and Time API is lead by folks responsible for Joda Time library, that's a great sign! The request well captures current problems and needs, and I can't wait to see it implemented as a part of JDK.

NetBeans IDE 6.0 Beta 1 is Out!

While searching for a nightly build of NetBeans I noticed that NB6 Beta 1 is out. Great!

I'm looking forward to using the new version. After spending the last couple of weeks (or months?) developing in NB6M10, I can't wait to see what this release brings.

The first thing that stuck me though is the lack of "drag&drop" installation on MacOS which was replaced with "pkg-style" installer. I liked the drag&drop installation better - it's more mac-ish. I hope the surprises that will follow will only be pleasant.

Thanks, NB guys!

Download link: http://bits.netbeans.org/download/6.0/milestones/latest/


Monday, July 02, 2007

NetBeans 6 Milestone 10 is out

My random check of the NetBeans site shows that NetBeans 6 M10 is out.

Release Notes New and Noteworthy in Milestone 10 Download

I'm looking forward to tasting the new bits. What a great way to start a new week. ;-)

Saturday, June 30, 2007

How TomTom Saved My Day

TomTom One in 3D Map Mode


As probably any other technology junkie out there, I had been looking at the evolution of car navigation systems and thinking about how cool it would be to have a device that could really make it easy to travel in a unknown area without having to worry about studying maps ahead of time or having another person filling out the role of a navigator.

A friend of mine bought a TomTom One recently and was telling me how great this device was. Not that he's untrustworthy person, but for some reason I accepted the information but didn't decide to take any further action.

On our last trip to Yosemite, I didn't pay attention to the direction I was driving for a moment and forgot to take a turn that I should have. This little mistake cost us 1 hour delay, wasted gas and created some frustration. At that point I revisited the information from my trustworthy friend and started looking for a GPS car navigation system that was affordable, yet feature rich and reliable.

Consumer Reports made it clear that TomTom One is the way to go. Other reviews as well as information from my trustworthy friend confirmed this.

Last week, my TomTom unit arrived, after I ordered it on the Internet. It looks good, is compact, and is very easy to use. In the following days I started to get to know it during my daily commute.

TomTom One is slim! I bet that many American's envy its figure :-)


It wasn't until last Thursday, that I had to put my TomTom into a real-world test. The main project that I work on right now at Sun is customization and deployment of Confluence for soon to be launched wikis.sun.com. Atlassian, the company behind Conluence, organized Atlassian User Group meeting in Stanford, that I was joining.

Even though I have been living in the San Francisco Bay Area for 2 years now, I don't know Stanford very well. The meeting was taking place in the Stanford campus, which is beautiful, but can be pretty challenging to navigate through thanks to many little streets with many intersections through out the campus. Combine all of that with my "talent" for doing things last minute and you get a person rushing to get somewhere where he's never been before. Sounds like a good challenge for my brand-spanking-new TomTom, right? ;-)

Well it really was. I left from Menlo Park campus much later than I originally planned to, so I quickly jumped into my car, input the destination address and headed out into the unknown.

TomTom picked a route that most likely I would have picked as well if I studied the maps or used Google Maps*. The fact that I didn't need to watch out for turns and making sure that I was on the right street made the whole "rush" much easier.

One thing that I observed during the first ride with TomTom was that the 3D maps that TomTom uses by default are really good. At first it seemed unnatural for me to use 3D maps instead of birds eye's view 2D maps. But after driving with the 2D maps on I quickly switched to the 3D view. It really is much easier to keep track of where you are and where you need to go on the 3D map!

There was one point during my travel to the meeting, when I truly appreciated having my TomTom. When I was already in the Stanford University campus, navigating through a maze of little streets, my TomTom said "Turn right", I tried, really tried - but the sign "Road construction. Road Closed" didn't let me go through. I had to take the only possible turn that there was and ignore the instructions. If I had just a small scrap of paper with driving instructions on it, I would have been lost. With TomTom there is no need for panic, I just took the only turn that I could, TomTom realized that something went wrong and recalculated the route taking into consideration my current position, successfully navigating me around the road construction.

I got to my destination on time and it wouldn't have been like that if it weren't for my TomTom One.

Night Mode


No product is perfect (at least not in my eyes ;-) ), so here is a few things that I'd like to see improved:
  • Reorganized menu - some items that are often needed are buried deep in the menu structure (e.g. clear route), others are not found where one would look for them (e.g. edit favorites)
  • Map Share technology recently announced with the TomTom Go 720 model, should become standard feature for all TomTom GPS products - to make this feature really useful they need to gain critical mass and to do that they should offer it in all products
  • Redo the TomTom Home application - currently I found almost no value in this app - it's just shopping desktop application that happens to be able to backup your TomTom. Did I mention that it crashed on me at least 5 times on my Mac during the few minutes that I used it so far?!? All in all the app is next to useless. Features like creating an itinerary, reviewing past trips, showing some statistics are lacking.
  • There are absolutely no statistics offered for the current trip, or just after reaching the destination. Americans love statistics, so it's interesting that such a feature is missing in a product that is successful on the American market ;-)
  • Rama brought up a good point while we were talking about the device - there is no way to tell your current elevation. Isn't that like the most basic feature of a GPS device?
  • The device seems to be a closed platform - software-wise as well as hardware-wise. I wish it was possible to write plugins that would make it possible to add some of the features that I miss. I haven't found any "developer" section on the tomtom.com website. If it was possible to connect the device with something else than bluetooth cellphones, it would be interesting to see what could one do with a combination of a TomTom and a SunSPOT - temperature, atmospheric pressure, humidity and acceleration readings, anyone? How about switching TomTom to the night mode when it gets dark outside? How many other possibilities would opening the platform enable?
  • Last but foremost - I'd appreciate having a button which when pushed would make a car in front of me disappear. There should be a limit on how many "clicks" one can make per day or week though, to avoid a large scale abuse of this feature, which might have undesirable side effects :-D


See also: TomTom One Caught Speeding!


* btw have you heard of the new real-time route adjustment feature? It would be really great if it was this easy to adjust the route in TomTom.

Tuesday, June 19, 2007

No Mustang for You Tiger! - JDK6 Only in Leopard

There are times when I hate to be right and today is definitely one of those days.

Just a month ago I wrote an entry "Where is Apple JDK6", in which I proposed an explanation for the sudden stop of releases of Apple JDK6 developer previews.

Today I read some news coming from WWDC, that proves my theory.
the fact that Java 6 will take advantage of new features only available in Leopard and the fact that the latest Java 6 preview requires the absolute latest Leopard preview confirms the suspicions many have had: First, Java 6 will not be released for OS X until Leopard ships. Second, Apple is going to continue its trend of forcing you to upgrade to the latest version of OS X if you want to use the latest version of Java.


Well, thank you Apple! As if the delay of Leopard due to some phone was not enough. :-/

One would hope that after Java went open source, it would be easier for Apple to integrate it into MacOS without any big delays. But apparently that's not the case.

Apple probably needs JDK6 as a feature of Leopard so that they can claim that Leopard has 300 new features. Without JDK6 the number would be 299 which doesn't look good in marketing presentations.

Sunday, May 20, 2007

Where Is Apple JDK6?

Apple usually takes its time to get Java on MacOS up to date with Sun's releases. But with JDK6 it seemed that things will be different. Apple kept on releasing "Developer Preview" versions of JDK along Sun's beta builds.

The last Java SE 6.0 Release 1 Developer Preview 6 was released on Sepember 13th 2006 and after that date Apple became quiet. What has happened?

All the unconfirmed and confirmed rumors about changes of the UI framework in the 10.5 version of MacOS X (Leopard), has given me a feeling that JDK6 got stuck because of Leopard's delay.

Each significant modification to the user interface has to be reflected in the Swing Java UI library. And since Leopard was scheduled to be released in spring 2007, I think that it was safe for Apple to modify Swing to support the latest UI and to release JDK6 along with Leopard.

That's why I think that the roadmap of JDK6 probably got disrupted by Leopard's delay. JDK6 simply can't be released because Leopard hasn't been released yet.

Does it mean that JDK/JRE6 won't run on Tiger? Unfortunately I think so. After all that's exactly what Apple did with JDK5 and MacOS X 10.3 Panther.

While writing this entry I stumbled upon an article by Matthew Schmidt from Javalobby, who has very similar feelings.

Does anyone have a better explanation?

Btw, I checked, Sept 13th 2006 wasn't a Friday, so we can't blame the delay on the date of last Developer Preview release :)

Monday, May 14, 2007

Hello I'm RubyOnRails, Hello I'm Java :-)

This is pretty good! The Java-developer half of me feels offended, but the RubyOnRails half is laughing hard :-D

Sunday, May 13, 2007

Java MVM (Multi-VM, Multitasking VM) resurrected?

While reading up on JavaFX (formerly F3), I stumbled upon a Chris Oliver's blog entry describing his approach to MVM. I was surprised to see that he was looking into this while working on F3.

It really makes sense, though. Java applications suffers from one major issue and that is the startup time. It takes quite a while for the almighty JVM to initialize and warm up. So to make JavaFX successful in the bloody battle with Flash this issue has to be resolved and his approach looks like a possible solution.

There used to be a project at SunLabs led by Grzegorz Czajkowski, called The Barcelona Project which was targeted for JDK7. Unfortunately this project got canned last year after Grzegorz left Sun for Google. I'm not quite sure why SunLabs froze the project. It definitely looked very promising.

One way or another I think that it's not going to take too long and (close to) instant start of Java apps will be real and Consumer JRE will be the solution.