 Deadlocks are one of those things that you wish didn't exist. Unfortunately they are a natural threat of multi-threaded programming and one must learn how to avoid them. A good Java example of deadlock prone code can be found here.
If a code is deadlock prone, it doesn't mean that the deadlock will occur. Deadlock will occur only when wrong actions take place at a wrong time (or order), which makes it really difficult to find and debug deadlocks. When an application is deadlocked it appears to do nothing while consuming only very little of CPU time. The chance of a deadlock appearing grows with the number of threads that execute deadlock prone code as well as with the number of repetitive executions of deadlock prone code (even if it is being executed by only a few threads). The conclusion of this is that if you stress your code by multi-threaded tests, it is more likely that a deadlock will appear compared to no testing, or testing the code only with single-threaded test cases. If a deadlock appears, the tests will freeze and that's about everything you will see. To track down what caused the deadlock is usually very difficult at this point.
JConsole comes to rescue
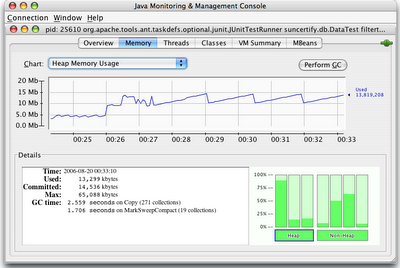
JConsole - Java Monitoring & Management Console, is a utility that is a part of the JDK since version 5.0 and has been greatly enhanced in upcoming JDK 6. JConsole is JMX based which enables it to easily connect to running JVM and monitor application running in JVM. The only requirement is to start JVM with parameter
com.sun.management.jmxremote as:
java -Dcom.sun.management.jmxremote YourLocalAppor
java -Dcom.sun.management.jmxremote.port=portNum YourRemoteApp
Once the JVM is running you can launch JConsole and connect to the JVM and start monitoring.


One of the features that has been enhanced is "Deadlock detection" located in "Threads" tab. Simply described: if your application gets deadlocked, you can start up the JConsole and see where the deadlock occurred, which threads are involved, and which thread owns and is blocked for which locks. Pretty cool :)

No comments:
Post a Comment